
Dashboard
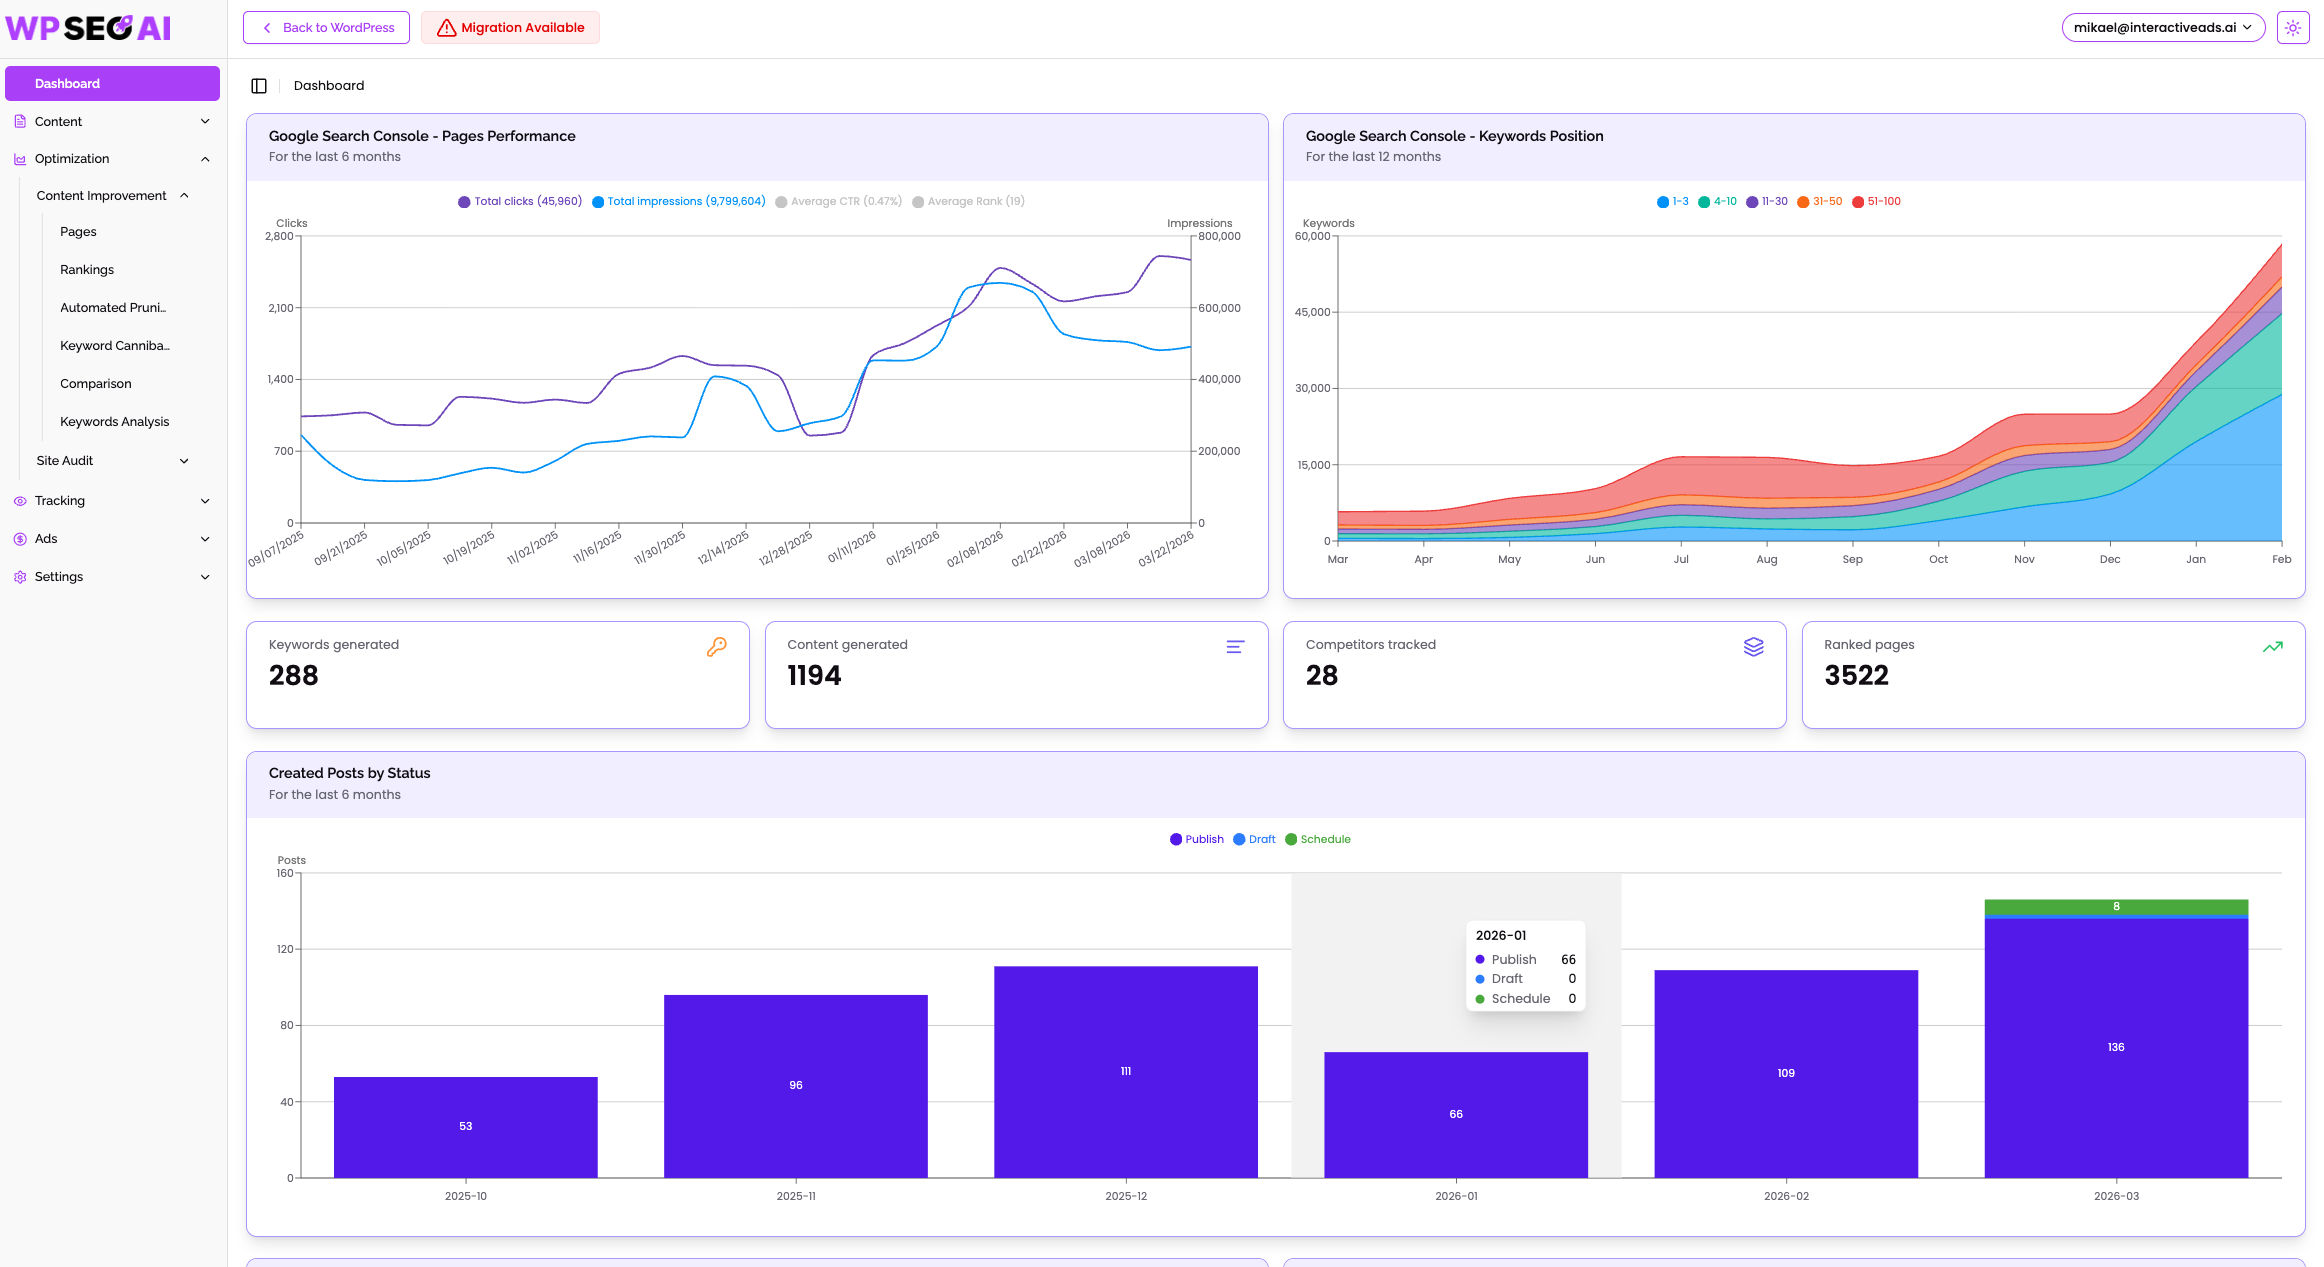
Track SEO performance
Monitor clicks, impressions, CTR, and average position over time.
Follow keyword rankings
See how many keywords rank in key position ranges like top 3, top 10, and top 30.
Measure content output
Track created, published, scheduled, and draft content month by month.
Find top keywords
Identify the search terms driving the most impressions, clicks, and visibility.
Discover top pages
See which URLs bring in traffic and deserve further optimization.
Monitor competitors
Compare your SEO progress against tracked competitors in your niche.
The reason
Why a great Dashboard matters
Why it matters
Turn SEO data into clear direction
What you get
Your Search mission control
Uses cases
How to use the Dashboard
Review performance metrics
Check keyword position ranges
Monitor content production
Analyze top keywords
Find top-performing pages
Compare competitor activity
You are currently viewing a placeholder content from YouTube. To access the actual content, click the button below. Please note that doing so will share data with third-party providers.
More InformationIn Detail
What exactly is the Dashboard?
The Dashboard is the central reporting hub inside WP SEO AI. It combines SEO performance data, keyword ranking insights, content production metrics, top-performing keywords, top pages, and competitor tracking into one clear overview. It uses connected performance and ranking data to help you understand what your content is doing in search. This makes it easier to measure progress, spot trends, and decide what to improve next.
Benefits - your unfair advantages using this feature:
Get instant clarity
Connect output to results
Spot growth trends
Prioritize optimization
Report with confidence
Verdict
Final thoughts
WP SEO AI’s Dashboard is built for teams who want one clear place to measure SEO progress.
Instead of jumping between multiple tools or guessing whether content efforts are paying off, you can see performance, production, rankings, and top opportunities in a single overview. This makes it easier to report results, justify content investment, and decide what to publish or optimize next.
The Dashboard turns SEO data into direction, so your next move is guided by what is actually happening.
FAQ
Everything you need to know about the Dashboard
What can I track in the Dashboard?
You can track clicks, impressions, CTR, average position, keyword rankings, content production, top keywords, top pages, and competitor activity.
Does the Dashboard show content production?
Can I see my best-performing keywords?
Can I see my best-performing pages?
Does the Dashboard include competitor tracking?
Who benefits most from this feature?
Book a demo
See the platform in action
Our experts are happy to give you a full tour through our platform. Book your spot now!
All features
Explore every feature in one place. Browse by use case, from AI content creation to tracking, optimization, search ads, and settings, and find all the features we use to make you successful in Search.
AI Writer
Create helpful content for your readers and future customers.
AI Blog Editor
Use our AI to edit content live with prompts inside the Gutenberg and Classic Editor.
AI Image Generation
Helping you to instantly craft beautiful, custom tailored visuals.
Content Calendar
Drag your blog drafts into the calendar to auto-schedule or publish them immediately.
Idea Generation
Generate the content ideas necessary to reach topical authority in your industry.
Internal Linking
Pave the way and establish a smart internal navigation for users and search engines.
Keyword Research
Discover long-tail keywords with low competition and high probabilty to rank #1.
Topical Map Generator
Organize, expand, and monitor your content clusters with AI-powered precision.
Translate Content
Use traditional WordPress translation plugins together with WP SEO AI to translate our blogs.
AI Visibility Tracking
Track your brand's visibility across leading LLMs like ChatGPT, Gemini, and Google’s AI Overviews.
AI Bot Tracking
See which AI bots crawl your website and identify pages to optimize for AI visibility.
Competitor Tracking
Spy on your competitors' SEO strategy and identify quick wins in order to outrank them.
Conversion Tracking
Connect your Google Analytics account with WP SEO AI and track conversions.
Keyword Analysis
Find all the keywords you are ranking with in Google and how they perform over time.
Technical SEO Audit
Analyse your page speed or other issues and get actionable insights to improve your technicals.
Content Improvement
Analyse your indexed content, get improvement ideas and execute them with one click.
Content Pruning
Detect and clean low performing content from your website to improve overal site quality.
Keyword Cannibalization
Strengthen the authority of your most important pages by detecting and solving keyword overlap.
Lead Form
Capture more leads with personalized, high-converting forms built directly into your blog content.
LLM Optimization
Discover the fan-out-queries behind every search in AI and optimize for them.
Mass Content Edit
Mass-Edit your content, add internal links or make your content more in-depth with one click.
Universal Page Optimization
Optimize all your pages based on data from Search Console, Google Ads & Google Analytics.
Search Ads
Create unique long-tail ads and optimize your own ads with smart filters.
Configuration
Transform our platform into a content teammate who truly understands your business.
Knowledge Bases
Build a pool of expert knowledge for your AI to reduce hallucinaiton and improve accuray in writing.
Prompt Library
Save, organise, and reuse your best-performing prompts across all major functions in the platform.